Week 19, 2016: UK Trade Balance
Summary: The UK's trade balance statistics for the first quarter of the year were released yesterday. The trade deficit rose to 2.9% of GDP (it has only been higher for a single quarter on three previous occasions since records began) driven by a bigger deficit in the trade of goods. However, single quarter figures are volatile, and the deficit for the last four quarters is roughly in line with the 21st century norm.
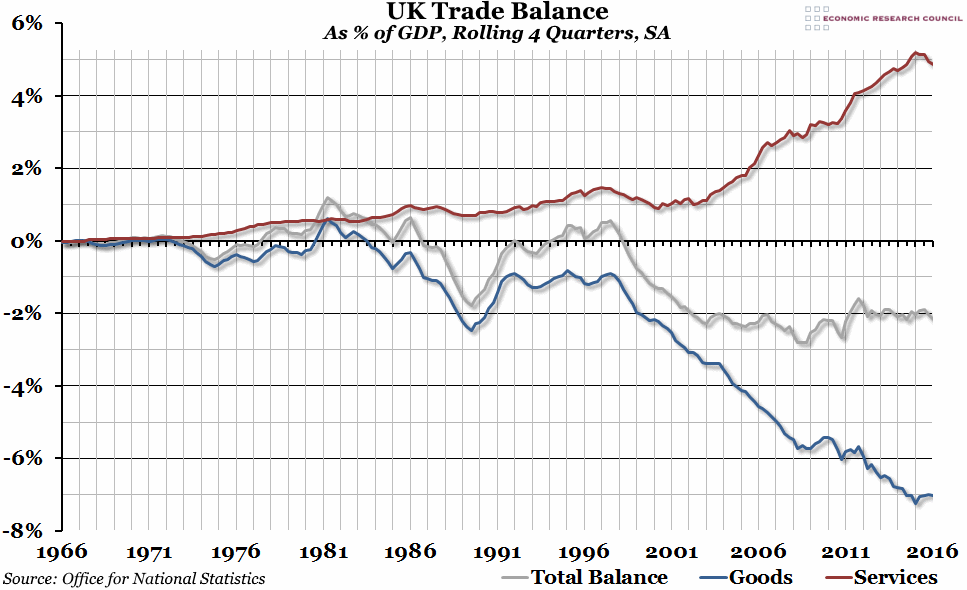
What does the chart show? The balance of trade is the difference between total exports and total imports (or net exports). A positive number means exports have exceeded imports, and vice versa. The grey line shows the total trade balance as a percentage of GDP, on a rolling four quarterly basis. The red and blue lines show the trade balance in services and goods respectively, also as a percentage of GDP.
Why is the chart interesting? The total trade deficit in the first quarter of 2016 was over £13bn for the first time since 2008 (when it briefly topped £14bn). That was equivalent to 2.9% of total GDP, which is one of the highest single quarter figures for at least the past sixty years (and probably longer). The single quarter trade balance figures are notoriously volatile, though, and have been especially so for the past five years. To counter this, we've taken the average of the previous four quarters in our graph this week, and this largely hides the poor performance in the most recent quarter. The rolling four quarter trade deficit has been around the 2% level since the turn of the century, which is the point when our trade deficit in goods began its decline from 1% to 7% of GDP. Fortunately, the UK has been running a trade surplus in services since the 1960s, and since 2003 that surplus has increased from 1% to 5% of GDP. That helps to close the gap a little, but over the past year or so that surplus has declined from a high of 5.4% to 4.7% for the past two quarters.
Next quarter's trade figures will be crucial in judging whether the first quarter was just a blip, or the start of another period of persistently higher trade deficits (like the UK experienced in 2008).


 Wednesday, May 11, 2016 at 12:32PM