Week 35, 2017: Historical Support for Tax Rises v.s. Corporation tax, VAT & Personal Allowance
Summary:
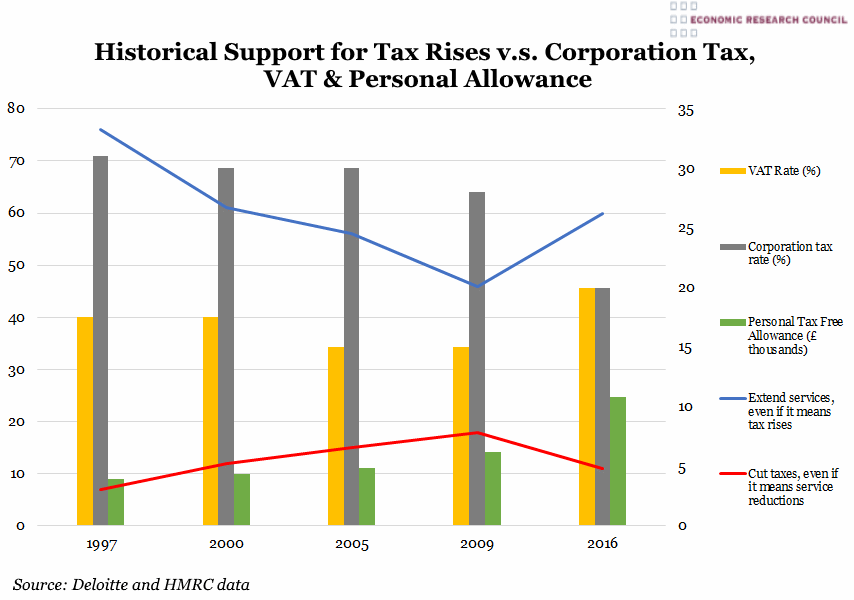
The chart shows that support for the raising of taxes to extend public services had been waning steadily between 1997 and 2009. In the same years, the proportion of those explicitly advocating tax cuts, with the consequent curtailment of public services, had been rising. The effect of the global financial crash is clear- following steady rises of over 3% in each year shown, in 2009 support for tax cuts fell by 7%. Similarly, support for more ‘tax-and-spend’ policies, which had been falling by an average of over 7% in each year shown, rose by 16% between 2009 and 2016. The tax-free personal allowance rose steadily by between £450-£1400 in the intervals shown until 2009. Following the crash, this allowance was raised by almost 60%. Tax cuts have been extended to business, with the corporation tax rate dropping from 31% in 1997 to 20% in 2016. VAT has not fluctuated as much, ranging from 15%- 20%. However variations in VAT are more acutely felt by those on low incomes as it is generally regressive in nature, with a 2009 study finding that those in the lowest income quintile spend 8.7% of their income on VAT, whereas those in the highest income quintile spend only 4%.
What does the chart show?
The bars display the rate of corporation tax (grey) and VAT (yellow) in percent, as well as the personal tax free allowance (green) in thousands of pounds. These are measured against the right hand axis. The lines represent percentages of 1099 representative adults polled and are measured against the left hand axis. The blue line shows the support for the extension of services even if it necessitates tax rises and in orange is the support for tax cuts, even if they entail service reduction.
Why is the chart interesting?
During the years 1997-2009, there was an absence of voices in parliament advocating for higher taxes to fund public services. A consensus had formed around the appeal of ‘enterprise-friendly’ low taxation. Indeed the mid-1990s saw the birth of ‘New Labour’, with centrist policies, as an explicit reaction to the perceived failure of ‘tax-and-spend’ policies of the past. From this date range, it is impossible to tell whether public opinion shaped the main parties’ policies or there was a general shift in Westminster toward the economic right, which public opinion consequently supported. It is interesting that with the introduction of austerity measures following the crash alongside the reduction in corporation tax, the tax proposals of the main political parties have begun to diverge.
 Thursday, September 7, 2017 at 4:39PM |
  Post a Comment


