Week 10, 2016: UK Interest Rate
Summary: Saturday marked the seventh anniversary of the Bank of England's introduction of the emergency 0.5% Bank Rate. Financial markets were correct this time last year when they forecast no change before next week's Monetary Policy Committee (MPC) meeting, but expectations for the next rate rise have been pushed out for another year (again).
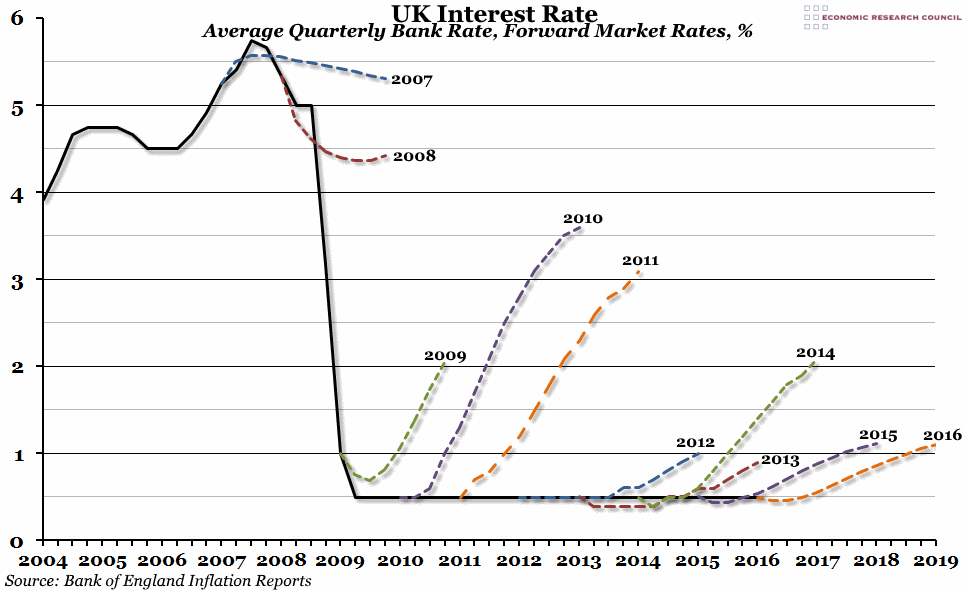
What does the chart show? The black line on the chart shows the official Bank Rate (the base interest rate set by the Bank of England), averaged out over each quarter, since the beginning of 2004. Each dashed line shows the forecast for future interest rates shown in each of the last ten February Inflation Reports. These estimates are based on the overnight swap rates in the three weeks leading up to the Report.
Why is the chart interesting? Every year, when we reach another anniversary of the "emergency" 0.5% rate that was introduced in March 2009 in response to the financial crisis, it is worth looking back at the market expectations reported in the Bank of England's Inflation Reports. Some look better than others with the benefit of hindsight: 2007 was fairly accurate until the financial crisis hit, and both 2012 and 2013 predicted long periods of sustained low interest rates (although not nearly long enough). Others haven't aged so well: the market expectations in February 2009 were that the Bank Rate would only fall to 0.75% before quickly recovering. The forecasts from 2010 and 2011 also look remarkably optimistic five years on.
The forecast from February 2015 was for another year of the 0.5% rate, followed by gradual increases to 1% over the course of a couple of years. The same thing was predicted last month, but with a year's delay. It looks likely now that we'll reach an eighth anniversary next year, and perhaps even a ninth and tenth. It feels like there is a greater possibility than ever before that when we look back in a few years, even these latest forecasts might seem optimistic if the MPC has decided to cut rates below 0.5%.


 Wednesday, March 9, 2016 at 1:46PM