Friday
Nov252011
Week 47, 2011: UK Business Investment

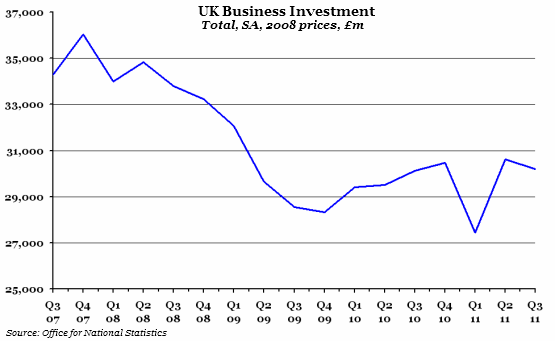
What does the chart show? The blue line shows total business investment in all UK industries, excluding spending on land, existing buildings and private dwellings. The figures are given in millions of pounds using 2008 prices.
Why is the chart interesting? Although provisional figures suggest that total business investment fell slightly this quarter, the relative consistency with last quarter seems to point to the terrible first quarter number as a one-off, and we are still some way off the low investment levels of 2009.
Hidden by the headline figure is the fact that investment in manufacturing actually went up this quarter by over 15%, although it was outweighed by a much smaller drop in non-manufacturing industries (because manufacturing investment represents a much smaller proportion of the overall number).


 Friday, November 25, 2011 at 9:01AM