Week 27, 2012: UK Business Investment

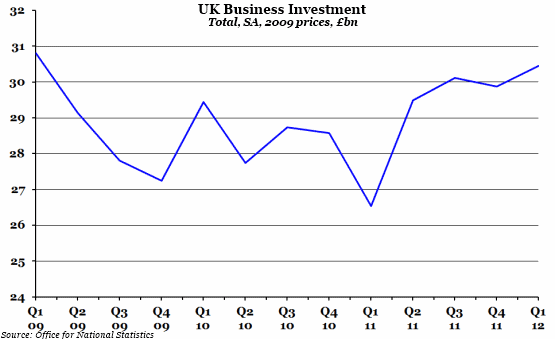
Summary: Revised UK business investment data was released this week which suggested that investment levels have somewhat recovered from the trough in 2009/10, and actually did so back in mid-2011.
What does the chart show? The blue line shows total seasonally adjusted business investment across all UK industries, excluding spending on land, existing buildings and private dwellings, in billions of pounds using 2009 prices.
Why is the chart interesting? There has been a serious decline in business investment in the UK since 2007/08, which is feeding in to the poor GDP figures. Recent revisions to the data by the ONS suggest that although the dips (in Q3/4 of 2009 and Q1 of 2011) were actually worse than initially reported, the recovery from them has been much sharper. However, we are still a long way off the levels of investment last seen back in 2007, and there doesn't appear to have been much improvement since mid-2011.


 Friday, July 6, 2012 at 1:08PM