Week 40, 2016: Net Investment in UK vs. Overseas Ordinary Shares by UK Financial Institutions
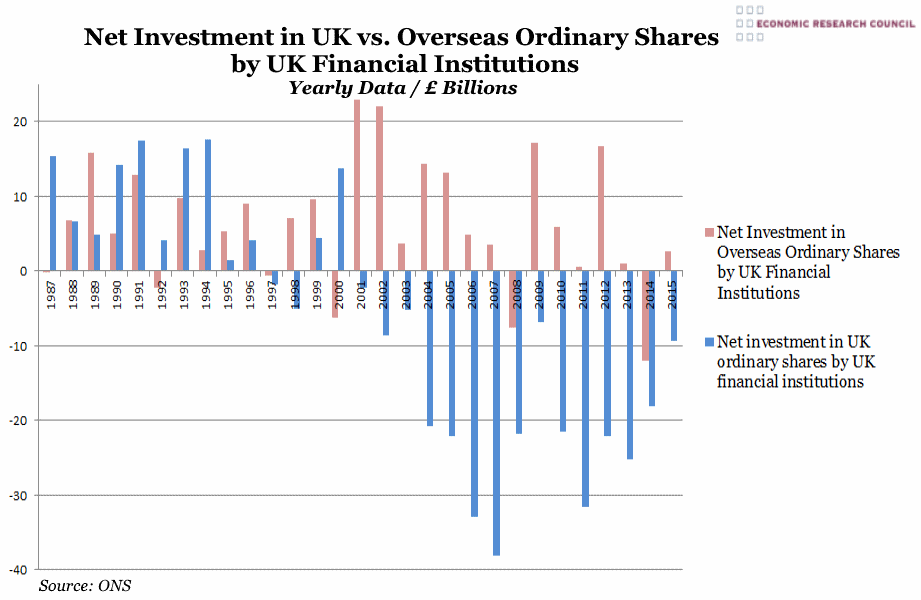
Summary: The chart shows that the year 2000 marked a turning point in financial institutions’ strategy, turning their focus to shares in international companies and away from investment in UK business. The pronounced trough in the run-up to the 2008 recession is particularly interesting, and signals not just the internationalisation of companies but also the financial institutions’ increasing preference for government bonds over equities. It also gives some insight into UK Financial Institutions’ spread of equities as we approach the triggering of Article 50 as well as revealing something of their attitude toward UK business.
What does the chart show? The blue bars show the net investment by UK Financial Institutions, (including insurance companies, pension funds and trusts) into ordinary shares in UK companies whereas the orange bars show investment into overseas companies. The data is yearly from 1987 until 2015 and in billions of pounds.
Why is the chart interesting? The chart shows that from the turn of the millennium, businesses became far more global with financial institutions benefitting from faster and easier access to international markets. This is indicated by negative net investment in UK-based companies since 2001. Following the bail-out in 2008 and much government optimism that this would encourage UK banks to support UK business it is interesting to see this has not translated into increased investment in UK shares. Since 2013, net investment overseas has not come close to the heights of the previous decade and the shortfall in UK investment has steadily reduced, perhaps indicating improving confidence in UK businesses relative to the world economy.


 Wednesday, October 5, 2016 at 3:43PM