Week 22, 2015: UK GDP Growth by Sector
Summary: Contrary to most economists' expectations, the overall growth rate in the first quarter of this year remained unchanged last week, at a disappointing 0.3% (most people had expected it to be revised upwards). However, contained in the ONS release was a breakdown of growth by sector, which showed that services are still leading the way in the UK.
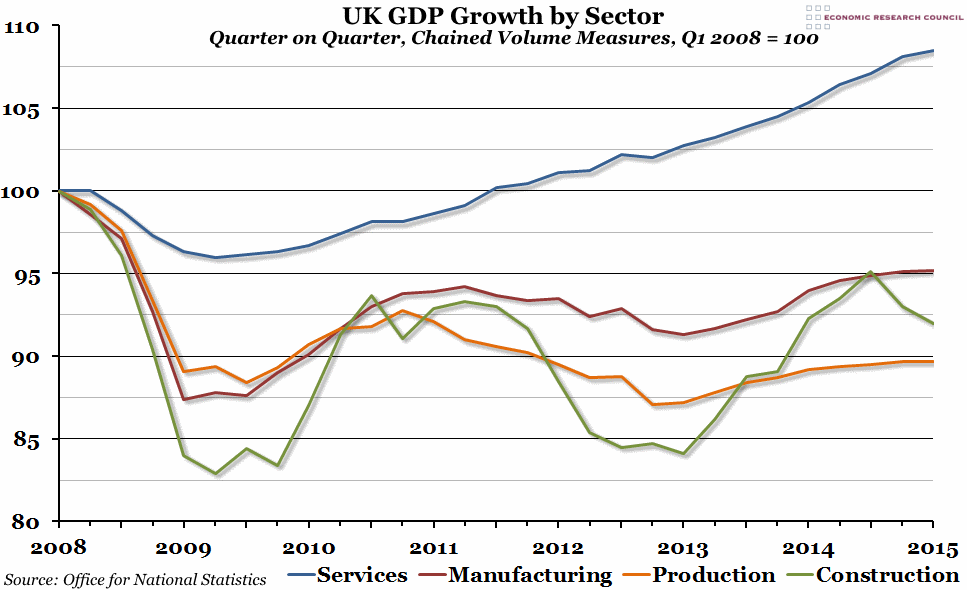
What does the chart show? The chart shows how output of the three main sectors making up the economy has changed since the peak of GDP at the beginning of 2008, indexed so that a value of 100 represents the output at that peak. The blue line shows the services sector (which is the biggest sector in the UK in employment terms), the orange line the production sector (a subset of which is manufacturing, represented here by the red line due to significant differences from the rest of the production sector), and the green line the construction sector.
Why is the chart interesting? Recent revisions to the GDP growth data now suggest that the services sector recovered to pre-crisis levels of growth back in mid-2011 (our chart last year suggested that recovery happened in 2013 instead), and is now producing 8.5% more than it was at the pre-crisis peak. However, the contrast with the other sectors of the economy is stark: both the construction and production sectors were hit particularly hard by the 2008 crash, and although initially they looked like they were bouncing back strongly, they both suffered a double-dip recession in 2011/12.
Manufacturing (a sub-set of the production sector) was affected the least, and although it is now producing more than it was in the 2011 mini-peak, it still has a long way to go to recover to pre-crisis levels of output. Overall production sector growth has remained very weak, and is still more than 10% below the pre-crisis peak with no real signs of recovery on the horizon. To make matters worse, while construction growth seemed strong in early 2014, it has since stalled, and is now heading in the wrong direction (providing a drag on the overall GDP figures).
 Wednesday, June 3, 2015 at 10:12AM |
  Post a Comment
  Construction,
  GDP,
GDP,  Manufacturing,
  Production,
  Sectors,
  Services


