Week 48, 2015: UK Average Earnings Forecasts
Summary: The Economic Research Council's fifth annual Clash of the Titans economic forecasting event was held on Wednesday 2nd December, where three economic experts gave their opinions on what will happen to the UK economy in 2016. In this week's chart, we've outlined one element of their forecasts: real average earnings.
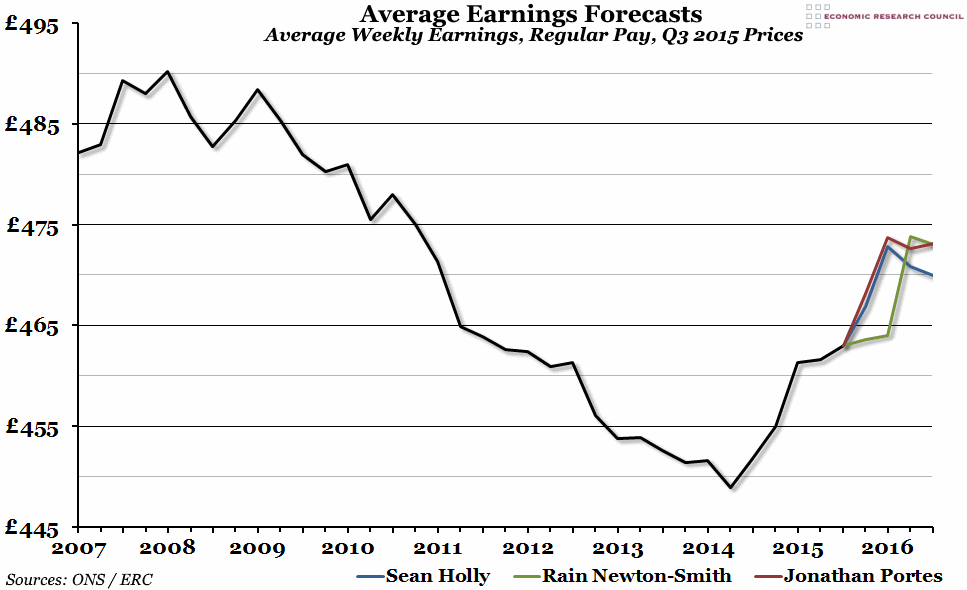
What does the chart show?The chart shows average weekly earnings (in GBP) for the whole economy, excluding bonus pay and arrears, adjusted for inflation so that it is in today's prices. The black line shows the real growth (or lack of it) since 2007, while the three coloured lines show the predictions of the three Titans - blue for Dr Sean Holly, green for Rain Newton-Smith, and red for Jonathan Portes.
Why is the chart interesting? The fall in real earnings between 2009 and 2014 was dramatic and sustained; the period between mid-2014 and mid-2015 has been the first full year of real earnings growth since before the crisis. In real terms, earnings today are back up to around the level that they were in late 2011, helped by rock bottom inflation rates. Our three forecasters have quite different ideas about what will happen next, although they all agree that by this time next year weekly wages will have risen to more than £470 in today's prices (equivalent to the end of 2010). Jonathan Portes and Dr Sean Holly both think we will see two strong quarters of real earnings growth in Q4 2015 and Q1 2016, driven largely by inflation rates staying very low (and even continuing to dip into negative territory), but then they diverge: Jonathan Portes thinks they will stay pretty flat in the middle of 2016, while Dr Holly thinks they will fall in real terms as inflation starts to pick up. Rain Newton-Smith has the highest expectations for inflation, and so thinks earnings growth wil be slow to begin with in real terms, before catching up very strongly in 2016.
 Wednesday, December 2, 2015 at 10:46AM |
  Post a Comment
  Earnings,
  Forecast,
  Wages,
  Weekly Income


