Week 8, 2017: Prime Residential Prices vs FDI and Global 500 HQs
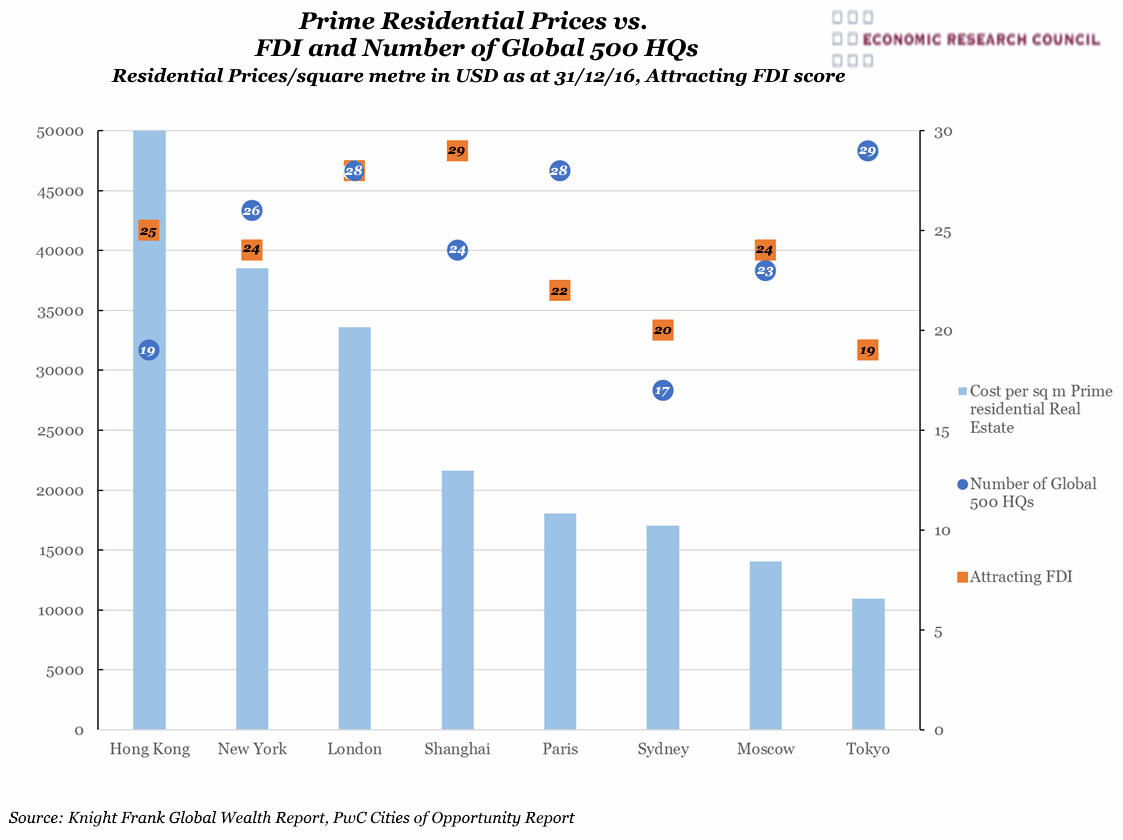
Summary: The chart shows that there is little to no correlation between the number of Global 500 companies headquartered in a city and the cost of prime real estate. However the very fact that so many of the world’s top companies are headquartered in these cities is not unrelated to the exorbitant cost of real estate. Nor indeed is there much correlation between the number of Global 500 HQs and the cities’ ability to attract foreign direct investment.
What does the chart show? The blue bars show the cost per square metre of prime residential real estate in a number of global cities measured against the left hand axis. The value per square metre is in USD using the exchange rate as of 31st December 2016. The other information originates from a report titled ‘Cities of Opportunity’ which analyses key global cities against a number of metrics, for example assigning each city a score based on its ability to attract foreign direct invest. This score for ability to attract FDI is shown here in orange squares against the right hand axis, along with the number of Global 500 companies headquartered in each city.
Why is the chart interesting? Stamp duty reform in London, primarily affecting homes over £900k, has lead to a lull in transactions and a 14% drop in price of homes in central London in the last year. Before any uncertainty around the appeal of London post-Brexit is considered, a buyer with USD already has 36% more purchasing power compared to before the Brexit referendum. The prime real estate cost in Hong Kong is double that of Shanghai which could be attributed to the relative availability of land, however it more likely reflects their divergent economic histories. Tokyo, although the most inexpensive for prime real estate, appears by this measure to be the most attractive to foreign investors. Tokyo has enjoyed substantial IT investment in recent years, capitalising on Japan’s position at the forefront of technology. The FDI metric is particularly interesting with Brexit on the horizon. London has always received high levels of FDI, which may be due to the accessibility of London via the city’s six international airports which serve 300 global locations directly, more than any other cities shown. Article 50 negotiations are likely to be closely monitored amid fears that without access to the single market, investments that were bound for London could instead be destined for competitors such as Dublin or Paris.


 Thursday, March 2, 2017 at 11:07PM